








Key takeaway: Nairobi is Kenya’s largest county economy, with 2024 Gross County Product of about KSh 4.11 trillion and 27.4% of national GVA, according to the national KNBS Gross County Product 2025 release. Kiambu, Nakuru, Mombasa and Meru complete the top five. Searchers often say “GDP”; the official county measure is GCP.
- Methodology
- What Is Gross County Product (GCP)?
- Top 10 Counties in Kenya by GCP in 2024
- Nairobi vs the Rest of Kenya
- Top Four Combined Contribution
- County Profiles
- 1. Nairobi City County — KSh 4.11 trillion
- 2. Kiambu County — KSh 819.8 billion
- 3. Nakuru County — KSh 771.8 billion
- 4. Mombasa County — KSh 711.1 billion
- 5. Meru County — KSh 525.8 billion
- 6. Machakos County — KSh 476.4 billion
- 7. Uasin Gishu County — KSh 382.7 billion
- 8. Kisumu County — KSh 370.9 billion
- 9. Kilifi County — KSh 321.4 billion
- 10. Kakamega County — KSh 316.4 billion
- Major Sectors Behind Leading Counties
- GCP vs GDP Per Capita
- How Concentrated Is Kenya’s Economy?
- Important to Know
- Frequently Asked Questions
- Bottom Line
- Sources

People searching for the richest counties in Kenya usually type “GDP.” At county level, the Kenya National Bureau of Statistics (KNBS) publishes Gross County Product (GCP) — the county equivalent of GDP.
This guide ranks the top 10 counties by 2024 GCP at current prices, using the national KNBS Gross County Product 2025 release. It measures the size of each county’s economy, not personal wealth or household income.
Methodology
Ranking uses 2024 Gross County Product at current prices from the national KNBS Gross County Product 2025 release. The figures represent the size of each county economy and are not measures of personal wealth or household income.
Shares of national Gross Value Added (GVA) for Nairobi (27.4%), Kiambu (5.5%), Nakuru (5.2%) and Mombasa (4.8%) are from the same KNBS data cycle. Together those four counties accounted for about 42.9% of national GVA in 2024.
This is a size ranking by total GCP, not a ranking by GCP per capita.
What Is Gross County Product (GCP)?
Gross County Product measures the market value of goods and services produced within a county’s borders over a period. National GDP does the same for the whole country.
KNBS compiles GCP so counties, investors and planners can see where economic activity is concentrated. When media say “county GDP,” they almost always mean GCP.
Top 10 Counties in Kenya by GCP in 2024
Mobile: Swipe left / right to see all columns → ←
| Rank | County | 2024 GCP at Current Prices | Share of national GVA | Main economic drivers |
|---|---|---|---|---|
| 1 | Nairobi City | KSh 4,105.6 billion (KSh 4.11 trillion) | 27.4% | Finance, trade, real estate, manufacturing, ICT, professional services |
| 2 | Kiambu | KSh 819.8 billion | 5.5% | Manufacturing, real estate, agriculture, Nairobi spillover |
| 3 | Nakuru | KSh 771.8 billion | 5.2% | Trade, farming, industry, tourism, energy |
| 4 | Mombasa | KSh 711.1 billion | 4.8% | Port, shipping, logistics, tourism, manufacturing |
| 5 | Meru | KSh 525.8 billion | About 3.5% | Agriculture (including miraa), dairy, trade |
| 6 | Machakos | KSh 476.4 billion | About 3.2% | Manufacturing, construction, logistics, Nairobi metro link |
| 7 | Uasin Gishu | KSh 382.7 billion | 2.6% | Maize and wheat, agro-trade, Eldoret commercial hub |
| 8 | Kisumu | KSh 370.9 billion | About 2.5% | Lake trade, fish, retail, services, manufacturing |
| 9 | Kilifi | KSh 321.4 billion | About 2.1% | Tourism, hospitality, cashew/coconut, coastal trade |
| 10 | Kakamega | KSh 316.4 billion | About 2.1% | Sugarcane, farming, local trade, small-scale mining |
← Swipe table left and right on mobile →
The ranking above uses 2024 GCP at current prices from the national KNBS Gross County Product 2025 release.
Nairobi vs the Rest of Kenya
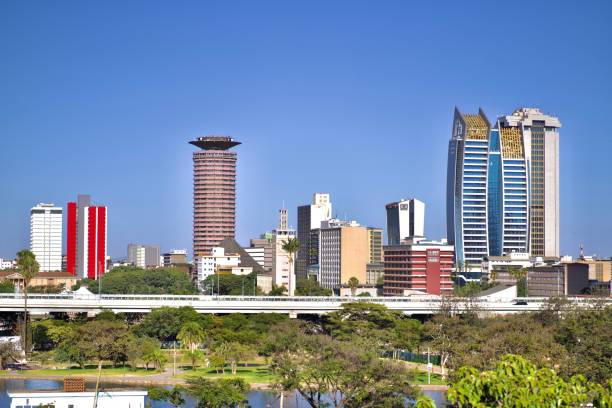
Nairobi sits alone at the top. At about KSh 4.11 trillion in 2024, its economy is several times larger than Kiambu’s. KNBS put Nairobi’s share of national GVA at 27.4% in 2024.
Output is driven by wholesale and retail trade, manufacturing, financial and insurance services, real estate, construction and professional services. Nairobi also leads GCP per capita in the same data cycle (about KSh 850,332).
That concentration shapes jobs, tax base, property markets and infrastructure demand well beyond the county boundary.
Official website: nairobi.go.ke
Top Four Combined Contribution
Nairobi, Kiambu, Nakuru and Mombasa together contributed about 42.9% of national GVA in 2024 (27.4% + 5.5% + 5.2% + 4.8%).
Meru and Machakos extend the upper tier. Each of the five largest county economies exceeded KSh 500 billion in the 2024 current-price estimates. Uasin Gishu and Kisumu sit just below that mark but still among the country’s largest non-capital economies.
County Profiles
1. Nairobi City County — KSh 4.11 trillion
Kenya’s commercial and administrative centre. Finance, corporate headquarters, real estate, manufacturing, ICT and professional services dominate total output and per capita productivity.
Website: nairobi.go.ke
2. Kiambu County — KSh 819.8 billion
Second-largest county economy. Manufacturing, housing, logistics and agribusiness (tea, coffee, dairy) benefit from proximity to Nairobi.
Website: kiambu.go.ke
3. Nakuru County — KSh 771.8 billion
A diversified Rift hub with farming, trade, industry, tourism and energy-related activity.
Website: nakuru.go.ke
4. Mombasa County — KSh 711.1 billion
Port of Mombasa, shipping, logistics, tourism and coastal manufacturing anchor the economy. Second-highest GCP per capita after Nairobi in the 2024 cycle (about KSh 530,747).
Website: mombasa.go.ke
5. Meru County — KSh 525.8 billion
Strong agricultural base, including miraa, dairy and food crops, with growing trade. Among Kenya’s leading agricultural contributors by share of sector GVA.
Website: meru.go.ke
6. Machakos County — KSh 476.4 billion
Manufacturing, construction and logistics linked to the Nairobi metropolitan region, plus industrial and residential growth along major transport corridors.
Website: machakosgovernment.com
7. Uasin Gishu County — KSh 382.7 billion
North Rift grain belt centred on Eldoret. Maize, wheat, agro-trade and services drive a 2.6% share of national GVA in 2024. National KNBS GCP 2025 places the county seventh by current-price size.
Website: uasingishu.go.ke
8. Kisumu County — KSh 370.9 billion
Lake Victoria port city serving western Kenya through fish trade, retail, services and manufacturing. Nominal GCP reached KSh 370.9 billion in 2024.
Website: kisumu.go.ke
9. Kilifi County — KSh 321.4 billion
Coastal tourism and hospitality, cashew and coconut farming, and coastal trade.
Website: kilifi.go.ke
10. Kakamega County — KSh 316.4 billion
Western Kenya agriculture, including sugarcane, plus local trade and small-scale mining activity.
Website: kakamega.go.ke
Major Sectors Behind Leading Counties
- Services and finance: Heavily concentrated in Nairobi
- Manufacturing: Nairobi leads; Mombasa, Kiambu and Machakos also important
- Agriculture: Meru, Nakuru, Uasin Gishu, Kakamega and other highland and western counties
- Transport and logistics: Mombasa port; Nairobi and Machakos corridors
- Real estate and construction: Nairobi, Kiambu and satellite towns
- Tourism: Mombasa, Kilifi, Nakuru
- Trade: All top counties, especially urban hubs
GCP vs GDP Per Capita
Total GCP answers: which county has the biggest economy?
GCP per capita answers: how much output is produced per resident?
They are different rankings. Nairobi leads both total size and per capita in the 2024 cycle. Mombasa ranks high per person because of the port and tourism base. Some agricultural counties can look smaller per person even when total farm output is large.
In 2024, national GDP per capita was about KSh 309,460. Counties reported above that average included Nairobi, Mombasa, Nyeri, Embu and Nakuru, among others. Lowest per capita levels remain concentrated in parts of the arid and semi-arid north and north-east.
This article ranks by total GCP, not per capita wealth.
How Concentrated Is Kenya’s Economy?
KNBS has shown that economic activity is concentrated in a few urban and peri-urban counties. The top four alone account for about 42.9% of national GVA. Dozens of counties each contribute less than 2%.
Growth rates can tell a different story. Some smaller or frontier counties have posted faster percentage growth than the national average while remaining small in absolute size. Size and growth speed should not be confused.
Important to Know
GCP figures are official estimates and can be revised when KNBS updates methods or releases a new report. Always check the latest publication on the Kenya National Bureau of Statistics website.
“Richest counties by GDP” in search language means largest Gross County Product here — not the wealthiest households or the highest incomes per person.
Read also:Top 10 Richest Entrepreneurs in Kenya 2026: Net Worth, Businesses & Assets
Frequently Asked Questions
Which is the richest county in Kenya in 2026?
By total economic size (2024 GCP at current prices in the national KNBS GCP 2025 release), Nairobi City County.
Which county has the largest economy in Kenya?
Nairobi, at about KSh 4.11 trillion in 2024.
What is the GDP of Nairobi County?
In ordinary language people say “GDP”; the official county figure is GCP — about KSh 4.11 trillion for 2024.
What is Gross County Product?
GCP is the value of goods and services produced within a county. It is the county-level counterpart to national GDP.
Which are Kenya’s top 10 counties by GCP?
Nairobi, Kiambu, Nakuru, Mombasa, Meru, Machakos, Uasin Gishu, Kisumu, Kilifi and Kakamega, using 2024 current-price figures from the national KNBS GCP 2025 release.
Which county has the highest GCP per capita?
Nairobi led in 2024 (about KSh 850,332), followed by Mombasa. That ranking is not identical to the total-size top 10.
What is the difference between GDP and GCP?
GDP is national. GCP is the same idea measured for each of the 47 counties. Media often say “county GDP” when they mean GCP.
Bottom Line
Kenya’s county output is highly concentrated. Nairobi alone accounts for more than a quarter of national GVA. Kiambu, Nakuru and Mombasa push the top four to about 42.9%. Meru, Machakos, Uasin Gishu and Kisumu fill out the next tier, followed by Kilifi and Kakamega.
Search traffic still says “richest counties by GDP.” The correct official label is Gross County Product from KNBS. Use total GCP for economic size, and GCP per capita for output per resident — and always confirm the reference year on the latest national KNBS release.
Sources
- Kenya National Bureau of Statistics (KNBS)
- KNBS – Gross County Product
- KNBS – Gross County Product reports
- Tuko – KNBS report on counties’ contribution to Kenya’s economy
- The Kenya Times – Top counties by GCP
- Stats Kenya – Gross County Product summary
- County Government of Kisumu
- Official county websites linked in profiles above
Primary ranking reference: 2024 Gross County Product at current prices from the national KNBS Gross County Product 2025 release. Later revisions may update figures. This article is for information only and is not investment or policy advice.