





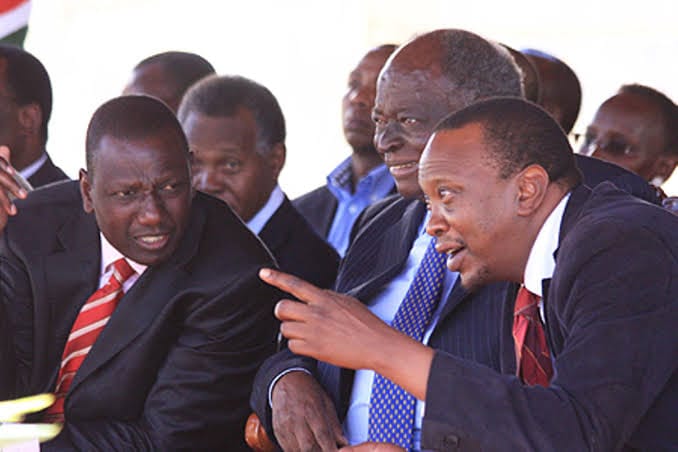
Key takeaway: Kenya’s public debt rose from roughly the low-to-mid hundreds of billions of shillings at the end of the Moi era to about KSh 13.0 trillion by end-June 2026 under President William Ruto. Kibaki grew debt more slowly as a share of the economy; Uhuru drove a large infrastructure-linked jump; Ruto has added several trillion shillings to an already large stock while servicing heavy maturities.
- How to Read the Numbers
- Overview Comparison
- Daniel arap Moi (1978 – 2002)
- Mwai Kibaki (2002 – 2013)
- Uhuru Kenyatta (2013 – 2022)
- William Ruto (2022 – present)
- Borrowing profile
- Where the money pressure shows up
- Projects and programmes often linked to the Ruto administration
- Who “Borrowed the Most”?
- Projects vs Debt Service
- Frequently Asked Questions
- Bottom Line
- Sources
Kenyan politics often reduces public debt to one question: who borrowed the most? A fair comparison needs more than a single number. Debt stocks change with new loans, repayments, guarantees, interest capitalisation and exchange-rate movements. A weaker shilling can lift the shilling value of dollar loans even when no new money arrives.
This guide compares four administrations of Daniel arap Moi, Mwai Kibaki, Uhuru Kenyatta and William Ruto using widely cited end-period stocks from National Treasury, Central Bank of Kenya (CBK) and media reporting based on those series. Where figures differ slightly by month or definition (gross public and publicly guaranteed debt), ranges are shown.
How to Read the Numbers
- Debt stock = what the government (and guaranteed entities) owed at a point in time.
- Stock increase ≠ cash “pocketed” or spent only on projects. It includes refinancing, FX valuation and deficit financing.
- Debt-to-GDP is often a better sustainability signal than nominal shillings alone.
- Moi-era shillings are not easily comparable to 2026 shillings without inflation and GDP context.
- Primary sources: National Treasury debt bulletins, CBK, Controller of Budget commentary, Budget documents.
Overview Comparison
Mobile: Swipe left / right to see all columns → ←
| Administration | Tenure | Debt near start | Debt near end / latest | Approx. stock change | Main borrowing / spend focus |
|---|---|---|---|---|---|
| Daniel arap Moi | 1978 – 2002 | Low by today’s standards (often cited from hundreds of millions into low billions early on) | About KSh 600–630 billion (end-2002 era, commonly cited) | Roughly into the KSh 600 billion range over a long tenure | Rural development, Nyayo programmes, state corporations; aid freezes constrained external finance |
| Mwai Kibaki | 2002 – 2013 | About KSh 600 billion | About KSh 1.8–1.9 trillion | About KSh 1.2–1.3 trillion | Revenue-led growth, roads, Free Primary Education, institutional revival |
| Uhuru Kenyatta | 2013 – 2022 | About KSh 1.8–1.9 trillion | About KSh 8.6–8.8 trillion (around handover / mid-2022 series) | About KSh 6.7–7.0 trillion | SGR, expressway, roads, power access, Eurobonds, China bilateral loans, devolution rollout costs |
| William Ruto | 2022 – present | About KSh 8.7–8.8 trillion (around Sept 2022 / June 2022 windows) | About KSh 13.0 trillion (end-June 2026, widely reported) | About KSh 4.2–4.3 trillion stock increase over ~4 years | Debt service and refinancing, fiscal deficit finance, housing, Hustler Fund, SHA transition, education staffing, sports infrastructure |
← Swipe table left and right on mobile →
By end-June 2026, total public and publicly guaranteed debt was reported around KSh 13.01 trillion, with domestic debt the larger share (about 56%) and external about 44% in several June 2026 summaries. Domestic debt alone was still rising into September 2026 (CBK weekly data showed gross domestic debt around KSh 7.73 trillion by 11 September 2026).
Debt-to-GDP in mid-2026 was reported around 68%–69% in Treasury-linked commentary — above Kenya’s 55% PV debt-to-GDP policy benchmark discussed in debt strategy documents.
Daniel arap Moi (1978 – 2002)
Borrowing profile
Moi’s long tenure sat in a different debt world. Absolute shilling stocks look small next to today’s trillions, but the period included structural adjustment, political conditionalities and, at points, frozen or constrained access to international finance when governance concerns rose with the World Bank and IMF.
Borrowing was not “zero.” It was more limited by today’s mega-project standards, and the state still carried domestic and external obligations while running a large public enterprise sector.
Projects and spending focus often linked to the era
- District Focus for Rural Development and decentralised local works
- Nyayo Wards in public hospitals
- Nyayo Milk programme in schools
- Major facilities begun or associated with the period, including Eldoret International Airport and Moi International Sports Centre (Kasarani)
- Roads and state corporation financing typical of a one-party then multiparty state economy
Takeaway: Moi left a debt stock commonly cited around the KSh 600 billion mark by 2002 — high in political memory then, modest in 2026 nominal terms.
Mwai Kibaki (2002 – 2013)
Borrowing profile
Kibaki is widely described as the more conservative modern borrower. Debt rose from about KSh 600 billion to about KSh 1.8–1.9 trillion, but strong GDP growth and improved tax collection meant debt-to-GDP fell for much of the decade (CBK-linked commentary has long noted a decline in debt-to-GDP through much of the 2000s before later rises).
The story is less “no borrowing” and more “growth and revenue did more of the heavy lifting.” KRA performance and economic recovery after 2002 reduced the need to lean only on foreign loans.
Projects and programmes often linked to the era
- Thika Superhighway
- Free Primary Education (FPE)
- Major trunk road rehabilitation, including work on key national corridors
- Efforts to revive struggling state entities such as Kenya Meat Commission and New KCC
- Broader public service and agricultural recovery agenda after the 1990s slowdown
Takeaway: Stock rose by roughly KSh 1.2–1.3 trillion over about a decade, but slower than the post-2013 jump, and paired with a better debt-to-GDP path for much of the term.
Uhuru Kenyatta (2013 – 2022)
Borrowing profile
Uhuru’s years mark the shift to multi-trillion infrastructure finance. Debt moved from about KSh 1.8–1.9 trillion to about KSh 8.6–8.8 trillion by the 2022 handover window — an increase on the order of KSh 6.7–7.0 trillion.
The mix changed: more commercial terms, Eurobond issuance, large bilateral borrowing (notably China-linked project finance), and heavy domestic securities issuance. Revenue grew, but debt stock grew faster. COVID-19 spending also added pressure late in the term.
Projects and programmes often linked to the era
- Standard Gauge Railway (SGR) Mombasa–Nairobi–Naivasha corridor
- Nairobi Expressway
- Major bypasses and highway packages (Nairobi, Mombasa, Eldoret and other corridors)
- Last Mile electricity connectivity expansion (access rose sharply from a low base)
- Devolution’s early national fiscal and infrastructure load after the 2010 Constitution
- Port and logistics works, including Kisumu port rehabilitation efforts
- Medical equipment leasing and related health infrastructure contracts (politically contested on value for money)
Takeaway: This is the administration most associated with “borrow to build” at scale. The visible assets are real; so is the repayment schedule the next government inherited.
William Ruto (2022 – present)
Borrowing profile
Ruto took office with debt already near KSh 8.7–8.8 trillion. By end-June 2026, total public and publicly guaranteed debt was widely reported at about KSh 13.01 trillion Which is a stock increase of roughly KSh 4.2–4.3 trillion in about four years.
That does not mean every shilling was a brand-new project loan. Reporting on the Ruto years stresses:
- Heavy debt service (principal + interest), including Eurobond and other external maturities
- Domestic market borrowing via Treasury bills and bonds
- Budget deficit financing and multilateral programme support
- Exchange-rate effects on the shilling value of external debt
Controller of Budget commentary in 2026 urged tighter borrowing discipline after the stock passed KSh 13 trillion and debt-to-GDP stayed well above the 55% policy benchmark discussed in strategy papers.
Where the money pressure shows up
- Debt service consuming a large share of revenue and budget
- Refinancing and repayment of inherited commercial and bilateral obligations
- Ongoing fiscal deficit finance while trying to protect priority programmes
Projects and programmes often linked to the Ruto administration
- Affordable Housing programme infrastructure and related financing debates
- Hustler Fund (Financial Inclusion Fund) capitalisation and rollout
- Social Health Authority (SHA) transition from the NHIF era, including public-officer and broader population coverage reforms
- Junior Secondary School (JSS) teacher recruitment and deployment under TSC (large-scale staffing drive; exact cumulative hire totals should be confirmed from TSC/Treasury releases as they are updated)
- Talanta Stadium, with government moves to name/launch the facility in honour of Raila Odinga (Raila Odinga International Stadium / related naming)
- Continued reliance on IMF/World Bank-linked budget and reform support in parts of the term
- Domestic debt deepening as external market conditions stayed tight
Takeaway: In nominal stock added per year, Ruto’s period is heavy because the base was already huge and maturities were front-loaded. Critics stress the speed of the rise; the government stresses inheritance, refinancing and the cost of keeping the state running while building priority social programmes.
Who “Borrowed the Most”?
Mobile: Swipe left / right → ←
| Lens | Rough result |
|---|---|
| Largest absolute stock increase (full term) | Uhuru (~KSh 6.7–7.0T over ~9–10 years) |
| Large increase on already high base (first ~4 years) | Ruto (~KSh 4.2–4.3T by June 2026) |
| Slower stock rise + better debt/GDP path for much of term | Kibaki |
| Long tenure, smaller absolute end stock by 2026 standards | Moi |
There is no single winner of a moral contest. Uhuru’s increase is the largest full-term stock jump in this comparison. Ruto’s increase is very large in a short time from a high base, with more of the cash flow story tied to servicing and refinancing what was already owed. Kibaki remains the reference for growth-and-revenue discipline. Moi sits in a different economic era.
Projects vs Debt Service
Voters often want a list of “things built.” Economists also watch interest and principal. Under recent years, debt service has rivalled or exceeded many development budget lines. That is why a shilling borrowed in 2014 or 2019 still shapes the 2026 budget.
Infrastructure can raise long-run growth if projects are well chosen and maintained. If project returns are weak, or if borrowing mainly closes recurrent gaps, the debt stock rises without a matching rise in ability to pay.
Read also:Kenya’s China Debt Drops 19% as World Bank Exposure Hits Sh1.7 Trillion
Frequently Asked Questions
What is Kenya’s public debt now?
About KSh 13.0 trillion at end-June 2026 on widely cited public and publicly guaranteed totals. Domestic debt continued to edge up into September 2026.
How much debt did Ruto inherit?
About KSh 8.7–8.8 trillion around the 2022 handover window, depending on the exact month and series.
How much did debt rise under Uhuru?
From about KSh 1.8–1.9 trillion to about KSh 8.6–8.8 trillion which is roughly KSh 6.7–7.0 trillion in stock terms.
Did Kibaki avoid borrowing?
No. Debt still rose, but more slowly relative to growth and revenue for much of his tenure.
Is stock increase the same as new loans?
No. FX moves, refinancing and accounting definitions matter.
What has Ruto’s government prioritised alongside debt service?
Housing, Hustler Fund, SHA health reforms, large education staffing needs for JSS, and sports infrastructure such as Talanta (with Raila Odinga naming plans), among other programmes.
Where should I verify the latest figure?
National Treasury monthly debt bulletins, CBK publications and the Controller of Budget.
Bottom Line
Moi left debt near the KSh 600 billion range. Kibaki took it to about KSh 1.9 trillion while leaning on growth and tax. Uhuru scaled borrowing for mega-infrastructure and left about KSh 8.7 trillion. Ruto has overseen a rise to about KSh 13 trillion by mid-2026, with a large share of fiscal pressure going to servicing and refinancing as well as new priority programmes.
For Kenyans, the practical question is not only who signed which loan. It is whether revenues, exports and project returns can carry the interest bill without crowding out classrooms, clinics and county transfers.
Sources
- National Treasury – debt monthly bulletins, budget statistical annexes, MTDS
- Central Bank of Kenya – weekly bulletins, public debt tables, weighted rates
- The Star – Ruto at 4: debt stock and use of funds
- Tuko – Controller of Budget on debt above KSh 13t
- Cytonn – Kenya public debt review 2026
- Kenya in Data – Uhuru vs Ruto four-year debt windows
- People Daily – domestic debt to KSh 7.73t (Sept 2026)
Debt statistics are revised and may differ by definition (gross vs net, inclusion of guarantees, end-month timing). This article is for information only and is not investment, fiscal or political advice. Confirm the latest stock in the current National Treasury bulletin before citing a single point estimate.