




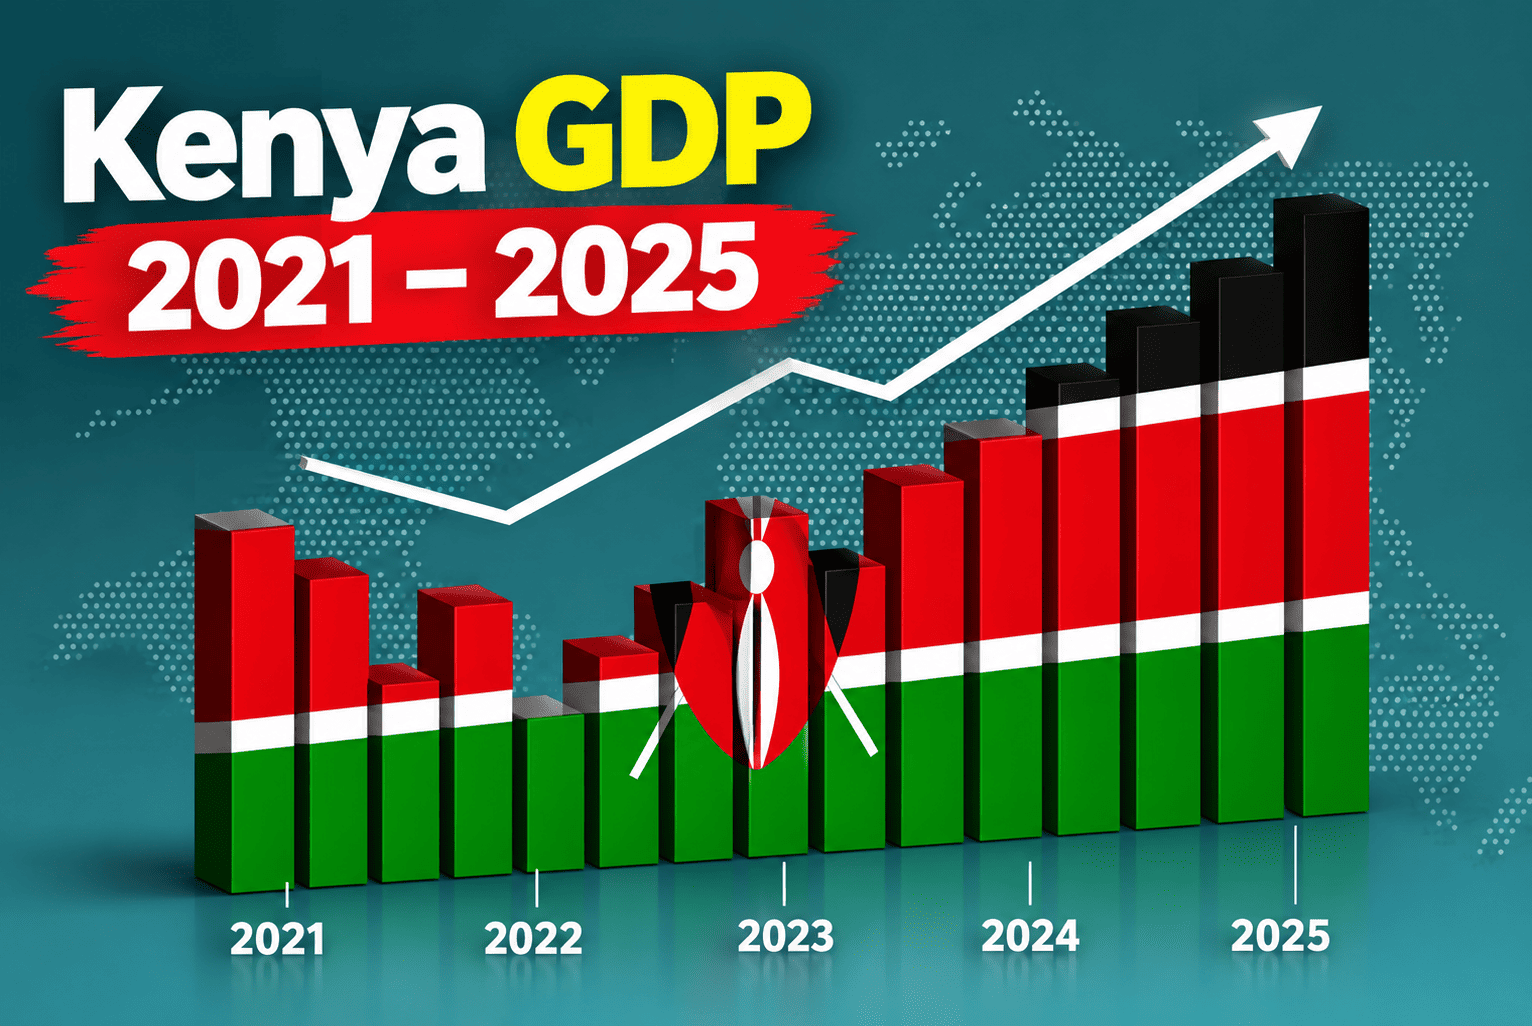
Kenya’s economy grew every year from 2021 to 2025, but the pace cooled after the strong post-pandemic rebound. By the end of 2025, nominal GDP stood at about $135.94 billion, or roughly KSh 17.6 trillion, according to the Kenya National Bureau of Statistics (KNBS) Economic Survey cycle and World Bank–linked dollar series.
- Kenya GDP Performance 2021–2025
- What Drove Growth Each Year
- 2021: Post-pandemic bounce (7.6%)
- 2022: Drought and politics (4.9%)
- 2023: Agriculture recovers, shilling bites (5.7%)
- 2024: Soft landing to 4.7%
- 2025: 4.6% and a larger shilling economy
- Real Growth vs Dollar GDP
- Structure of the Economy
- Early 2026: A Stronger Start
- How to Read These Numbers if You Run a Business
- Frequently Asked Questions
- Bottom Line
Real growth measures how fast the economy expands after inflation. Nominal GDP in dollars can rise or fall with the exchange rate even when output in Kenya shillings is growing. That is why 2023 looks weaker in US dollars than in local-currency terms.
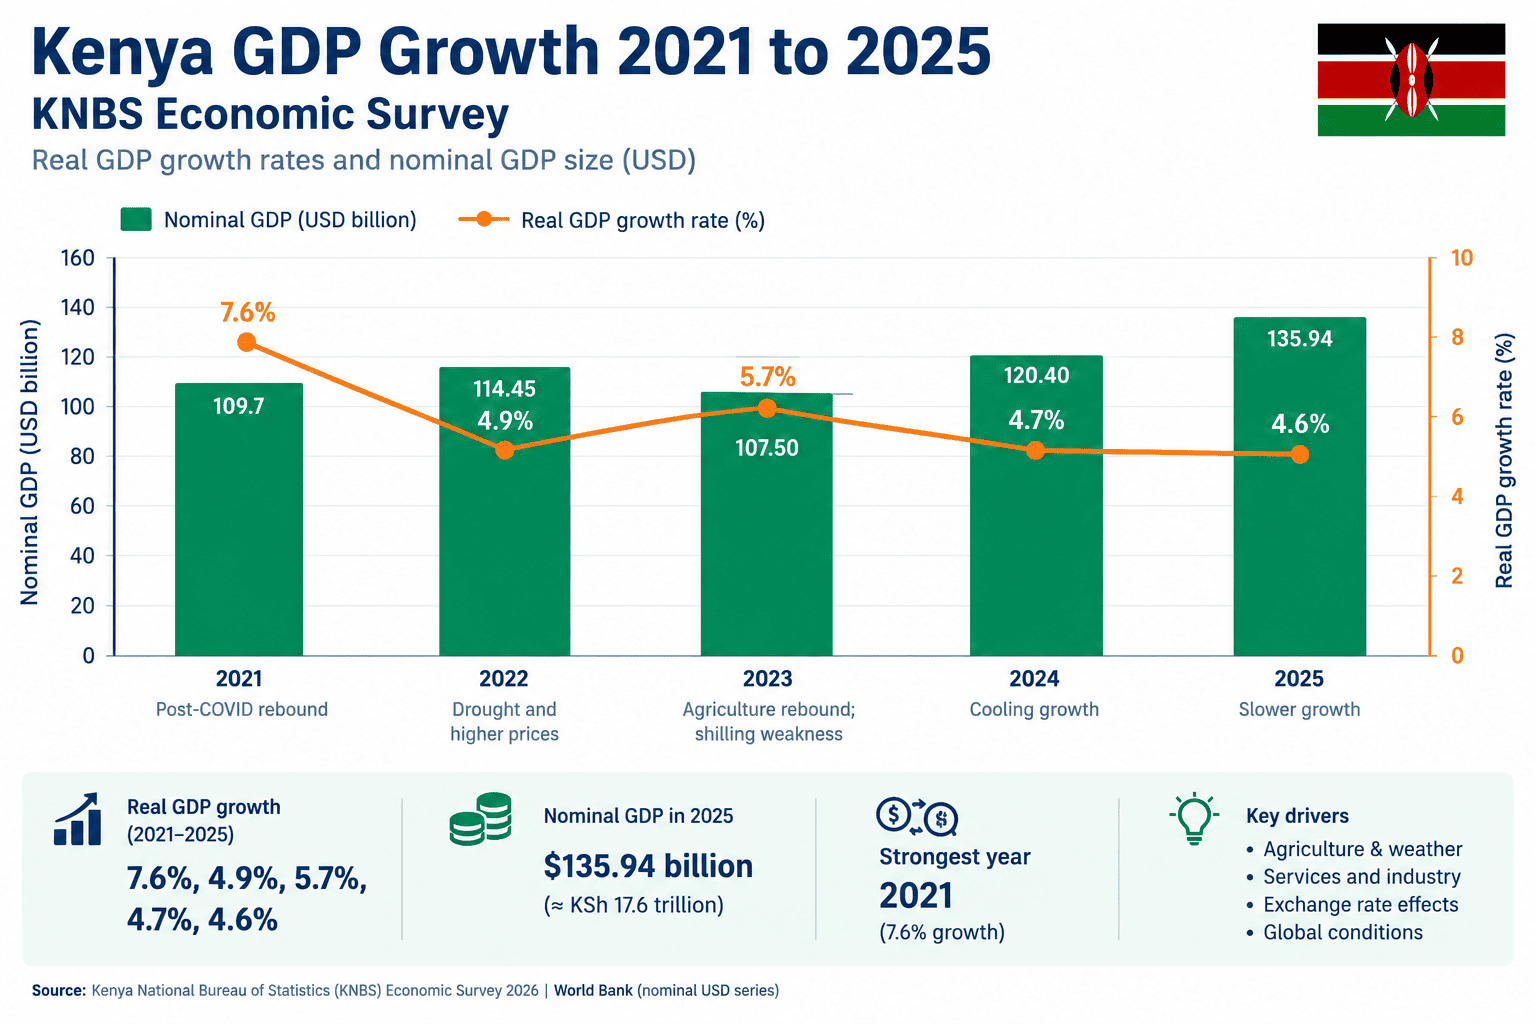
Key takeaway: KNBS’s latest five-year sequence for real GDP growth is 7.6% (2021), 4.9% (2022), 5.7% (2023), 4.7% (2024) and 4.6% (2025). Early 2026 then started stronger, with Q1 growth at 5.3%.
Kenya GDP Performance 2021–2025
The table below uses KNBS constant-price growth rates from the 2026 Facts and Figures / Economic Survey series, plus widely used nominal US-dollar GDP levels. Shilling GDP for 2024–2025 is from the same KNBS cycle.
Swipe left and right on mobile →
| Year | Real GDP growth | Nominal GDP (USD bn) | Main context |
|---|---|---|---|
| 2021 | 7.6% | 109.7 | Strong post-COVID rebound in services and industry |
| 2022 | 4.9% | 114.45 | Drought, higher global prices, election-year uncertainty |
| 2023 | 5.7% | 107.50 | Agriculture rebound; shilling weakness cut USD nominal value |
| 2024 | 4.7% | 120.40 | Cooling growth; KSh GDP about 16.2 trillion |
| 2025 | 4.6% | 135.94 | Slowest of the five years; KSh GDP about 17.6 trillion |
KNBS first published 2021 growth at 7.5% in the 2022 Economic Survey. The 2026 Facts and Figures series revises it to 7.6%. Use 7.6% as the current official figure for this five-year comparison.
For dollar GDP, 2021 is about $109.7 billion and 2022 about $114.45 billion. Some secondary tables wrongly repeat $114.45 for both years.
What Drove Growth Each Year
2021: Post-pandemic bounce (7.6%)
After the 2020 contraction, 2021 delivered the strongest growth of the five-year window. Services and industry reopened as COVID restrictions eased. Base effects from the lockdown year also lifted the percentage increase. Agriculture was the main soft spot that year.
2022: Drought and politics (4.9%)
Growth cooled to 4.9%. Severe drought hit food production and livestock. Global energy and food prices rose. The general election cycle added uncertainty for private investment.
2023: Agriculture recovers, shilling bites (5.7%)
Real growth rose to a revised 5.7% as rains improved and agriculture recovered. In dollar terms, GDP fell to about $107.5 billion because the shilling depreciated. Output in Kenya shillings still rose; the dollar translation was weaker.
2024: Soft landing to 4.7%
KNBS reported real GDP growth of 4.7% in 2024, down from the revised 5.7% in 2023. Nominal GDP in shillings moved to about KSh 16.2 trillion. Construction and mining were soft; financial services and parts of agriculture still supported growth.
2025: 4.6% and a larger shilling economy
The 2026 Economic Survey put 2025 real growth at 4.6%, a slight further slowdown from 4.7%. Nominal GDP rose to about KSh 17.6 trillion (roughly KSh 1.4 trillion higher than 2024, or about 8.6% in current prices). Agriculture remained a large share of the economy (over 20%, about 23% in recent survey framing). Services still dominated output. Weaker agricultural weather in parts of the year and softer manufacturing momentum weighed on the headline rate, even as construction and mining rebounded from 2024 contractions.
Real Growth vs Dollar GDP
Three numbers answer different questions:
- Real GDP growth (%) – best measure of how fast the economy is expanding in volume terms. Use this for “is growth speeding up or slowing?”
- Nominal GDP in KSh – size of the economy in local prices. Useful for debt ratios, tax and budgets.
- Nominal GDP in USD – useful for cross-country comparison, but moves with the exchange rate. A weaker shilling can shrink dollar GDP even when Kenyans produce more.
That is why 2023 can show solid real growth and a lower dollar GDP at the same time.
Structure of the Economy
By the mid-2020s, KNBS sector shares typically look roughly like this:
- Services – majority of GDP (around half to mid-50% in recent surveys)
- Agriculture, forestry and fishing – about one-fifth to just over 23%, still the largest employer
- Industry (manufacturing, construction, mining, utilities) – smaller share, but critical for jobs and exports
Most new jobs still come from informal activity. Formal wage employment remains a minority of total employment. That pattern did not reverse in 2024–2025 even as headline GDP expanded.
Early 2026: A Stronger Start
KNBS reported that the economy grew 5.3% in the first quarter of 2026, up from 4.9% in Q1 2025. Tourism and hospitality led (accommodation and food services around 14.7%), with solid construction and an improvement in manufacturing. Agriculture remained the largest sector by size, supported by tea, milk and cane deliveries, even if its growth rate was a touch softer than a year earlier.
Full-year 2026 will depend on rains, oil and fertiliser prices, fiscal execution and global conditions. One quarter is not a full-year outturn.
How to Read These Numbers if You Run a Business
- 4.6–7.6% growth over this window is a rebound followed by moderation, not a continuous boom.
- Agriculture weather still moves food prices, rural incomes and inflation.
- Services and finance have been steadier growth engines in recent surveys.
- Dollar contracts and imports feel exchange-rate swings that nominal USD GDP also captures.
- Q1 2026 at 5.3% is a useful signal, not a guarantee for the rest of the year.
Read also:Kenya GDP Growth by Presidential Era 1963–2026
Frequently Asked Questions
What was Kenya’s GDP growth rate in 2021?
KNBS’s latest series (2026 Facts and Figures) puts 2021 real growth at 7.6%. The original 2022 Economic Survey figure was 7.5%.
What was Kenya’s GDP growth rate in 2025?
4.6%, slightly below the revised 4.7% in 2024.
What is Kenya’s GDP in 2025 in shillings and dollars?
About KSh 17.6 trillion in current prices, and about $135.94 billion in widely used nominal dollar series.
Why did dollar GDP fall in 2023 while real growth rose?
Because the shilling weakened. Real growth tracks volumes; dollar GDP also tracks the exchange rate.
What was the strongest year in this period?
2021, at 7.6% real growth, on the post-COVID rebound.
Is Kenya’s economy growing in 2026?
Q1 2026 grew 5.3% year-on-year according to KNBS. Full-year figures will be published later in the Economic Survey cycle.
Where should I check official GDP data?
The Kenya National Bureau of Statistics Economic Survey, Facts and Figures, and quarterly GDP reports are the primary domestic sources.
Bottom Line
From 2021 to 2025 Kenya’s real GDP growth path, on the latest KNBS series, is 7.6%, 4.9%, 5.7%, 4.7% and 4.6%. The economy in shillings reached about KSh 17.6 trillion in 2025, while nominal dollar GDP rose to about $135.94 billion after a 2023 dip driven by exchange-rate effects. Early 2026 started stronger at 5.3% in Q1.
Use real growth for the speed of expansion, shilling GDP for domestic scale, and dollar GDP carefully when comparing countries or planning FX-linked business.
Sources: KNBS – Kenya Facts and Figures 2026 (growth rates 2021–2025: 7.6%, 4.9%, 5.7%, 4.7%, 4.6%; GDP at current prices); KNBS – 2026 Economic Survey (2025 growth 4.6%); KNBS – 2025 Economic Survey (2024 growth 4.7%; revised 2023 5.7%); People Daily – Q1 2026 GDP 5.3%; World Bank / FRED / Macrotrends nominal USD series for 2021–2025. KNBS revises historical series over time; always check the latest release.