




Kenya’s real GDP grew by 4.6 per cent in 2025, slightly slower than 4.7 per cent in 2024, according to the Kenya National Bureau of Statistics (KNBS) 2026 Economic Survey. First-quarter 2026 data showed a firmer start, with growth at 5.3 per cent compared with 4.9 per cent in the same period of 2025.
- At a Glance: GDP Growth Across Presidential Eras
- Recent Context: 2023–Q1 2026
- 1. Jomo Kenyatta Era (1963–1978): Post-Independence Boom
- 2. Daniel arap Moi Era (1978–2002): Stagnation and Structural Adjustment
- 3. Mwai Kibaki Era (2002–2013): Recovery and Vision 2030
- 4. Uhuru Kenyatta Era (2013–2022): Infrastructure, Debt and COVID
- 5. William Ruto Era (2022–Present): Fiscal Consolidation and BETA
- What the Numbers Do and Do Not Mean
- Selected Recent Annual Growth Rates
- Frequently Asked Questions
- Which president had the highest GDP growth in Kenya?
- What is Kenya’s current GDP growth rate?
- How much did the economy grow under Uhuru Kenyatta?
- How is the Ruto administration performing on growth?
- What is the difference between GDP growth and GDP size?
- Where can I get official GDP data?
- Bottom Line
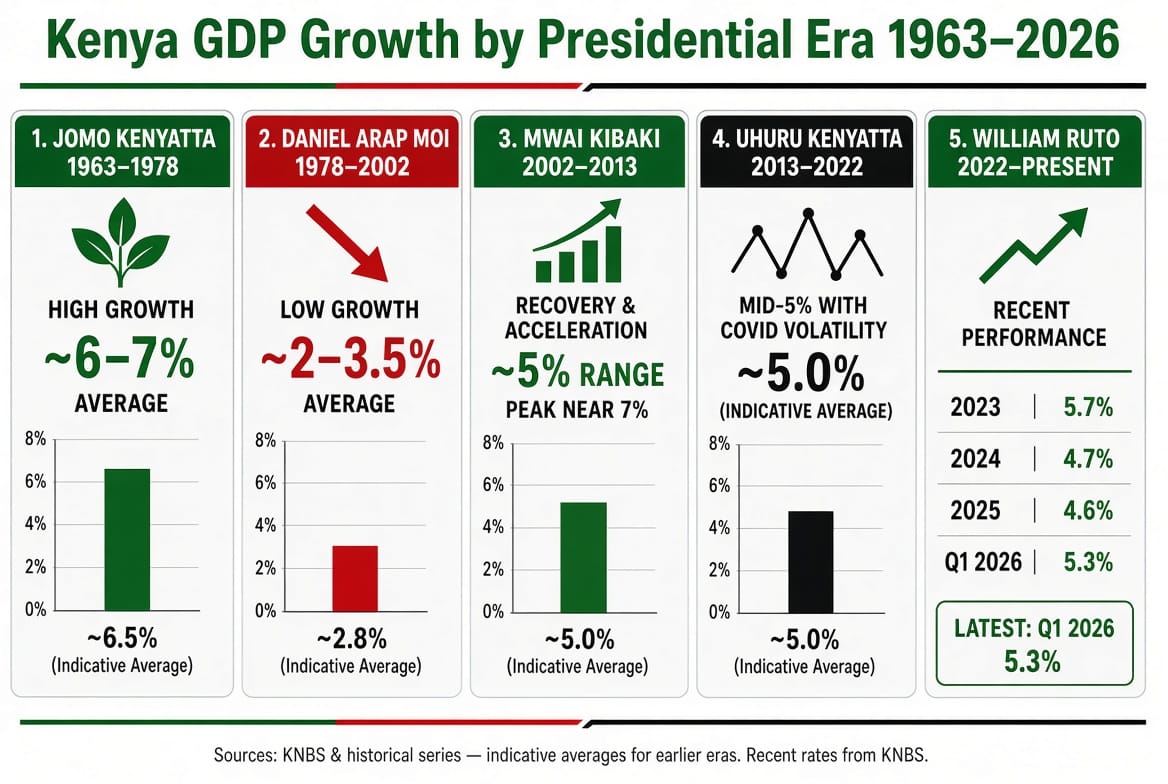
Those numbers sit inside a longer story. From independence under Jomo Kenyatta through Daniel arap Moi, Mwai Kibaki, Uhuru Kenyatta and William Ruto, average growth, volatility and the drivers of expansion have changed. This guide compares the eras using official KNBS releases for recent years and established World Bank–style historical series for earlier decades. It is a comparison of growth rates and context, not a ranking of presidents.
How to read this article: Recent annual and quarterly rates are from KNBS. Longer-run “era averages” are approximate ranges drawn from historical GDP series. Exact multi-year presidential averages are not published as official scorecards by KNBS.
At a Glance: GDP Growth Across Presidential Eras
Swipe left and right on mobile to view the full table →
| Presidential era | Tenure | Indicative average real GDP growth | Main policy / growth story |
|---|---|---|---|
| Jomo Kenyatta | 1963–1978 | High (commonly ~6%–7% range in long-run series) | Post-independence expansion, agriculture, early industry |
| Daniel arap Moi | 1978–2002 | Low (often ~2%–3.5% range) | State enterprises, SAPs, aid freezes, stagnation |
| Mwai Kibaki | 2002–2013 | Recovery (peak near 7% in 2007; era often ~5% range) | ERS, Vision 2030, tax reform, infrastructure restart |
| Uhuru Kenyatta | 2013–2022 | Mid-5% range with high volatility (COVID shock) | Big Four, debt-funded infrastructure, devolution |
| William Ruto | 2022–present | 5.7% (2023), 4.7% (2024), 4.6% (2025); Q1 2026: 5.3% | BETA, fiscal consolidation, debt service pressure |
Sources for recent years: KNBS Economic Survey 2025 and 2026; KNBS Quarterly GDP First Quarter 2026. Historical ranges: World Bank and long-run academic/historical GDP series. Treat era averages as indicative, not official presidential scores.
Recent Context: 2023–Q1 2026
KNBS data shows a clear softening after 2023, then a firmer first quarter of 2026:
- 2023: 5.7 per cent real GDP growth (revised figure cited in subsequent Economic Surveys).
- 2024: 4.7 per cent.
- 2025: 4.6 per cent.
- Q1 2026: 5.3 per cent, up from 4.9 per cent in Q1 2025.
In 2025, growth was supported across sectors even as the overall rate eased. Agriculture grew more slowly than the year before. Construction and mining rebounded after contractions in 2024. Services, including accommodation and food services, remained important contributors. Nominal GDP continued to expand in absolute terms even as real growth cooled.
Q1 2026 growth was broad-based. Accommodation and food services, mining, construction, financial and insurance services, manufacturing and agriculture all posted positive rates, with agriculture expanding about 4.9 per cent in the quarter.
1. Jomo Kenyatta Era (1963–1978): Post-Independence Boom
Kenya’s early independence years are widely associated with relatively high average real growth compared with later decades. Long-run series commonly place the era in a high single-digit average range, with some years extremely strong and others weak.
Growth was linked to agricultural expansion, land settlement for smallholders, strong commodity demand for coffee and tea, and early industrialisation under Africanisation policies. The economy was smaller and more open to commodity cycles than today.
External shocks still mattered. The 1970s oil crises raised import costs and inflation pressures toward the end of the era. Historical year-by-year series also show sharp swings, so the “boom” label describes the long average more than a smooth year-to-year path.
2. Daniel arap Moi Era (1978–2002): Stagnation and Structural Adjustment
Average real growth fell sharply relative to the 1960s and early 1970s. Many long-run summaries place Moi-era growth in a low single-digit band, often around 2–3.5 per cent, with several years near zero or negative in real terms.
Early years retained state-led industrial and agricultural controls. Later years brought Structural Adjustment Programmes under IMF and World Bank pressure: price liberalisation, privatisation and reduced public enterprise support. Political tension, multi-party transition costs, corruption concerns and donor aid freezes weighed on investment and confidence.
By the late 1990s and early 2000s, growth was frequently too low to raise living standards quickly for a rising population. That low base is the backdrop against which the Kibaki recovery is usually measured.
3. Mwai Kibaki Era (2002–2013): Recovery and Vision 2030
Kibaki’s first years marked a clear rebound from the late Moi period. Growth rose from low single digits in 2003 toward mid-single digits and higher mid-decade.
Key policy markers included the Economic Recovery Strategy, stronger tax administration, free primary education and the launch of Vision 2030. Infrastructure projects such as the Thika Superhighway became visible symbols of the recovery narrative.
Peak annual growth around 2006–2007 is often cited near 6.5–7 per cent in historical series (sources differ slightly by series and revision). The 2007–2008 post-election violence then cut growth sharply in 2008, before a recovery later in the second term. The era average is therefore stronger than Moi’s but still shaped by that political shock.
4. Uhuru Kenyatta Era (2013–2022): Infrastructure, Debt and COVID
Growth under Uhuru Kenyatta typically stayed in a mid-single-digit range outside the pandemic years. Large public investment programmes, the Standard Gauge Railway, expressways, devolution spending and the Big Four Agenda (manufacturing, universal health, affordable housing and food security) defined the policy story.
Debt-financed infrastructure supported construction and related activity but pushed public debt higher. The COVID-19 shock produced a brief contraction in 2020 (about –0.3 per cent in widely used series), followed by a strong rebound in 2021 (around 7.5–7.6 per cent).
The era’s average therefore depends heavily on whether the COVID years are weighted equally with pre-pandemic years. Headline growth looked resilient in many years, but volatility and debt service rose as lasting constraints for the next administration.
5. William Ruto Era (2022–Present): Fiscal Consolidation and BETA
President Ruto took office in September 2022. Full calendar-year KNBS growth rates available so far are:
- 2023: 5.7 per cent
- 2024: 4.7 per cent
- 2025: 4.6 per cent
Q1 2026 growth of 5.3 per cent is the strongest quarterly reading relative to the same quarter a year earlier since the recent slowdown, according to KNBS.
Policy focus under the Bottom-Up Economic Transformation Agenda (BETA) has emphasised agriculture support, manufacturing and MSMEs, alongside fiscal consolidation, tax reforms and heavy debt servicing. Growth has remained positive but lower than the 2023 peak and lower than early Kibaki and early Uhuru years in several three-year comparisons published by local media using KNBS data.
Constraints include inherited debt service, higher living costs in parts of the period, protest-related uncertainty around tax measures, and external cost shocks. Agriculture and services remain critical for any sustained rebound.
What the Numbers Do and Do Not Mean
Real GDP growth measures the change in the volume of goods and services produced. It is not the same as household income, job quality, inequality or the cost of living. A 5 per cent growth rate on a larger economy also creates more absolute output than the same rate on a smaller base.
Comparisons across eras face several traps:
- Population growth means GDP per capita can lag headline GDP growth.
- Series are revised when KNBS updates base years and methodologies.
- Shocks (oil crises, drought, election violence, COVID, global commodity spikes) can dominate any single year.
- Debt-funded growth can raise GDP now while raising future interest payments.
For that reason, this article reports verified recent rates precisely and treats older era averages as indicative ranges with sources, rather than exact presidential league tables.
Selected Recent Annual Growth Rates
Swipe left and right on mobile →
| Year | Real GDP growth | President (calendar year) |
|---|---|---|
| 2020 | About –0.3% | Uhuru Kenyatta (COVID year) |
| 2021 | About 7.5%–7.6% | Uhuru Kenyatta |
| 2022 | About 4.8%–4.9% | Transition year (Uhuru / Ruto) |
| 2023 | 5.7% | William Ruto |
| 2024 | 4.7% | William Ruto |
| 2025 | 4.6% | William Ruto |
| Q1 2026 | 5.3% | William Ruto |
Annual rates for 2023–2025 and Q1 2026: KNBS. Earlier pandemic-era figures: KNBS / World Bank historical series (minor differences can appear across revisions).
Read also:Kenya Public Debt by President: Moi, Kibaki, Uhuru & Ruto Compared
Frequently Asked Questions
Which president had the highest GDP growth in Kenya?
There is no single official presidential ranking. Jomo Kenyatta’s era is associated with the highest long-run average in many historical series. Peak single years appear in different eras (including strong post-independence years and the 2021 rebound). Use full-era context, not one year alone.
What is Kenya’s current GDP growth rate?
The latest full-year KNBS figure is 4.6 per cent for 2025. Q1 2026 real GDP grew 5.3 per cent year on year.
How much did the economy grow under Uhuru Kenyatta?
Most non-COVID years were in a mid-single-digit range. 2020 contracted slightly; 2021 rebounded strongly. Exact era averages depend on which years and which revised series you include.
How is the Ruto administration performing on growth?
KNBS shows 5.7 per cent in 2023, 4.7 per cent in 2024 and 4.6 per cent in 2025, with Q1 2026 at 5.3 per cent. Growth has stayed positive but slowed after 2023.
What is the difference between GDP growth and GDP size?
Growth is the percentage change. Size is the absolute value of output. Kenya’s economy can still expand in shillings even when the growth rate slows.
Where can I get official GDP data?
Start with the Kenya National Bureau of Statistics Economic Surveys and Quarterly GDP reports. Cross-check long historical series with World Bank World Development Indicators where useful.
Bottom Line
Kenya’s growth path has shifted from high post-independence averages under Jomo Kenyatta, through a long low-growth stretch under Moi, a recovery under Kibaki, debt- and infrastructure-heavy expansion under Uhuru Kenyatta, and positive but softer rates under William Ruto so far. KNBS currently places full-year 2025 growth at 4.6 per cent and Q1 2026 at 5.3 per cent.
Presidential-era comparisons help with context. They do not, by themselves, prove that any single policy package caused every percentage point of growth. For decisions that depend on the numbers, use the latest KNBS release and treat older averages as historical ranges.
Sources: KNBS 2026 Economic Survey (2025 real GDP growth 4.6%); KNBS 2025 Economic Survey (2024 growth 4.7%; 2023 revised 5.7%); KNBS Quarterly GDP First Quarter 2026 (Q1 2026 growth 5.3%); World Bank and long-run GDP growth series for historical years; secondary reporting on era comparisons (Nairobi Business Monthly, academic historical tables). GDP series are subject to revision. This article is for information only and is not economic or investment advice.