







I&M Group has reported a 20.3% increase in net profit attributable to shareholders to KSh 9.31 billion for the six months ended 30 June 2026, up from KSh 7.73 billion a year earlier. Group profit after tax rose 22.4% to KSh 10.17 billion, crossing the KSh 10 billion mark for the first time.
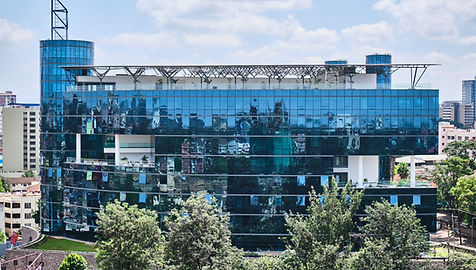 I&M Group headquarters. The bank recorded stronger half-year earnings driven by higher net interest income and non-interest revenue.
The performance was supported by solid growth in both lending and fee-based income. Net interest income climbed 22.5% to KSh 25.04 billion, while non-interest income rose 24.5% to KSh 8.66 billion.
Key Financial Highlights (H1 2026)
| Metric | H1 2025 | H1 2026 | Change |
|---|---|---|---|
| Profit Attributable to Shareholders | KSh 7.73 billion | KSh 9.31 billion | +20.3% |
| Group Profit After Tax | KSh 8.31 billion | KSh 10.17 billion | +22.4% |
| Net Interest Income | KSh 20.44 billion | KSh 25.04 billion | +22.5% |
| Non-Interest Income | KSh 6.96 billion | KSh 8.66 billion | +24.5% |
| Customer Deposits | KSh 429.37 billion | KSh 505.16 billion | +17.7% |
| Net Loans & Advances | KSh 290.26 billion | KSh 333.81 billion | +15.0% |
Customer deposits expanded 17.7% to KSh 505.16 billion, while the loan book grew 15% to KSh 333.81 billion. Gross non-performing loans fell 12.4% to KSh 30.11 billion, and net NPLs dropped 36.2% to KSh 7.58 billion, showing clearer asset quality despite the larger loan book.
Regional subsidiaries in Uganda, Rwanda, Tanzania and Mauritius now contribute about 33% of group pre-tax profit, up from 25% a year earlier. The group also continued shifting towards retail and MSME clients, lifting its customer base to 1.1 million.
Staff costs rose 23.8% to KSh 5.91 billion and loan-loss provisions increased 37.7% to KSh 5.60 billion as the bank invested in people and risk buffers.
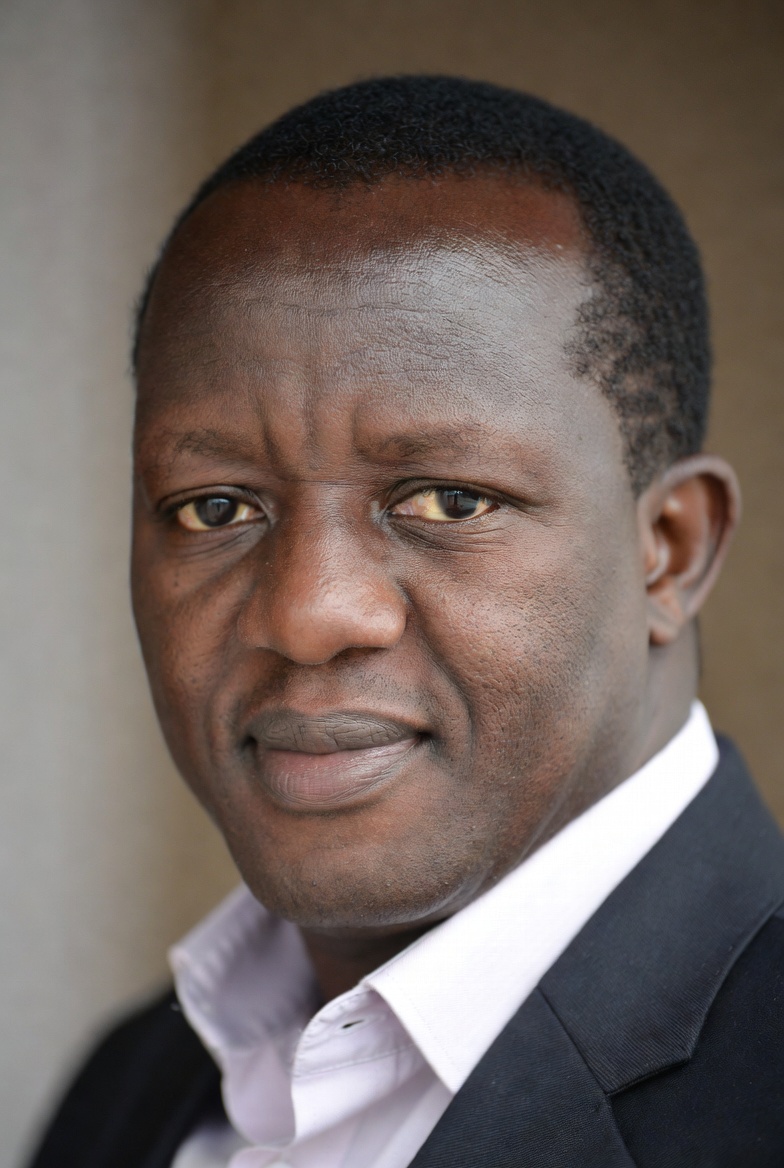
I&M is also preparing for a leadership change. Former Absa Bank Kenya executive Abdi Mohamed has been appointed CEO of I&M Bank Kenya to lead the next phase of growth.
How I&M Compares with Selected Peers
The half-year results place I&M among the stronger mid-to-large lenders. For context, here is how selected peers performed in the same period:
| Bank / Group | Profit After Tax | YoY Growth | Total Assets | Customer Deposits |
|---|---|---|---|---|
| Equity Group | KSh 45.5 billion | +32% | KSh 2.16 trillion | KSh 1.59 trillion |
| KCB Group | KSh 36.87 billion | +14% | KSh 2.30 trillion | KSh 1.70 trillion |
| Co-operative Bank | KSh 18.02 billion | +28% | KSh 869.47 billion | KSh 621.27 billion |
| NCBA Group | KSh 12.40 billion | +12.2% | — | KSh 551.00 billion |
| Absa Bank Kenya | KSh 10.53 billion | -9.8% | KSh 558.10 billion | KSh 380.70 billion |
| I&M Group | KSh 10.17 billion | +22.4% | KSh 746.31 billion | KSh 505.16 billion |
Equity and KCB continue to dominate on absolute size and profit. Co-operative Bank held a clear third place with strong growth. NCBA and Absa sit just ahead of I&M, though the gap between Absa and I&M is now less than KSh 400 million. I&M’s 22.4% growth rate outpaced several larger peers and helped it move ahead of Standard Chartered Bank Kenya in the half-year profit ranking.
Regional diversification remains a common theme. Non-Kenyan markets contributed roughly 42% of Equity’s profits, 33% of I&M’s and about 30% of KCB’s.
Read also:HFCB Group Net Profit Jumps 59.9% to KSh 998.3 Million in H1 2026
—I&M Bank Kenya — Corporate & Retail Banking, Kenyatta Avenue
What the Numbers Show
I&M’s first-half results show steady top-line growth, improving asset quality and a meaningful contribution from regional subsidiaries. The bank has also made progress in broadening its customer base beyond large corporates.
With a new CEO taking over at the Kenyan bank and the group already past the KSh 10 billion profit milestone, attention will now turn to how the retail and MSME push and regional operations perform in the second half of the year.
Sources
- Business Daily – I&M Group H1 2026 results
- I&M Group official half-year results announcement
- Nairobi Securities Exchange filings
- Equity Group, KCB Group, Co-operative Bank, NCBA Group and Absa Bank Kenya H1 2026 results